BC Map – Test and Practice
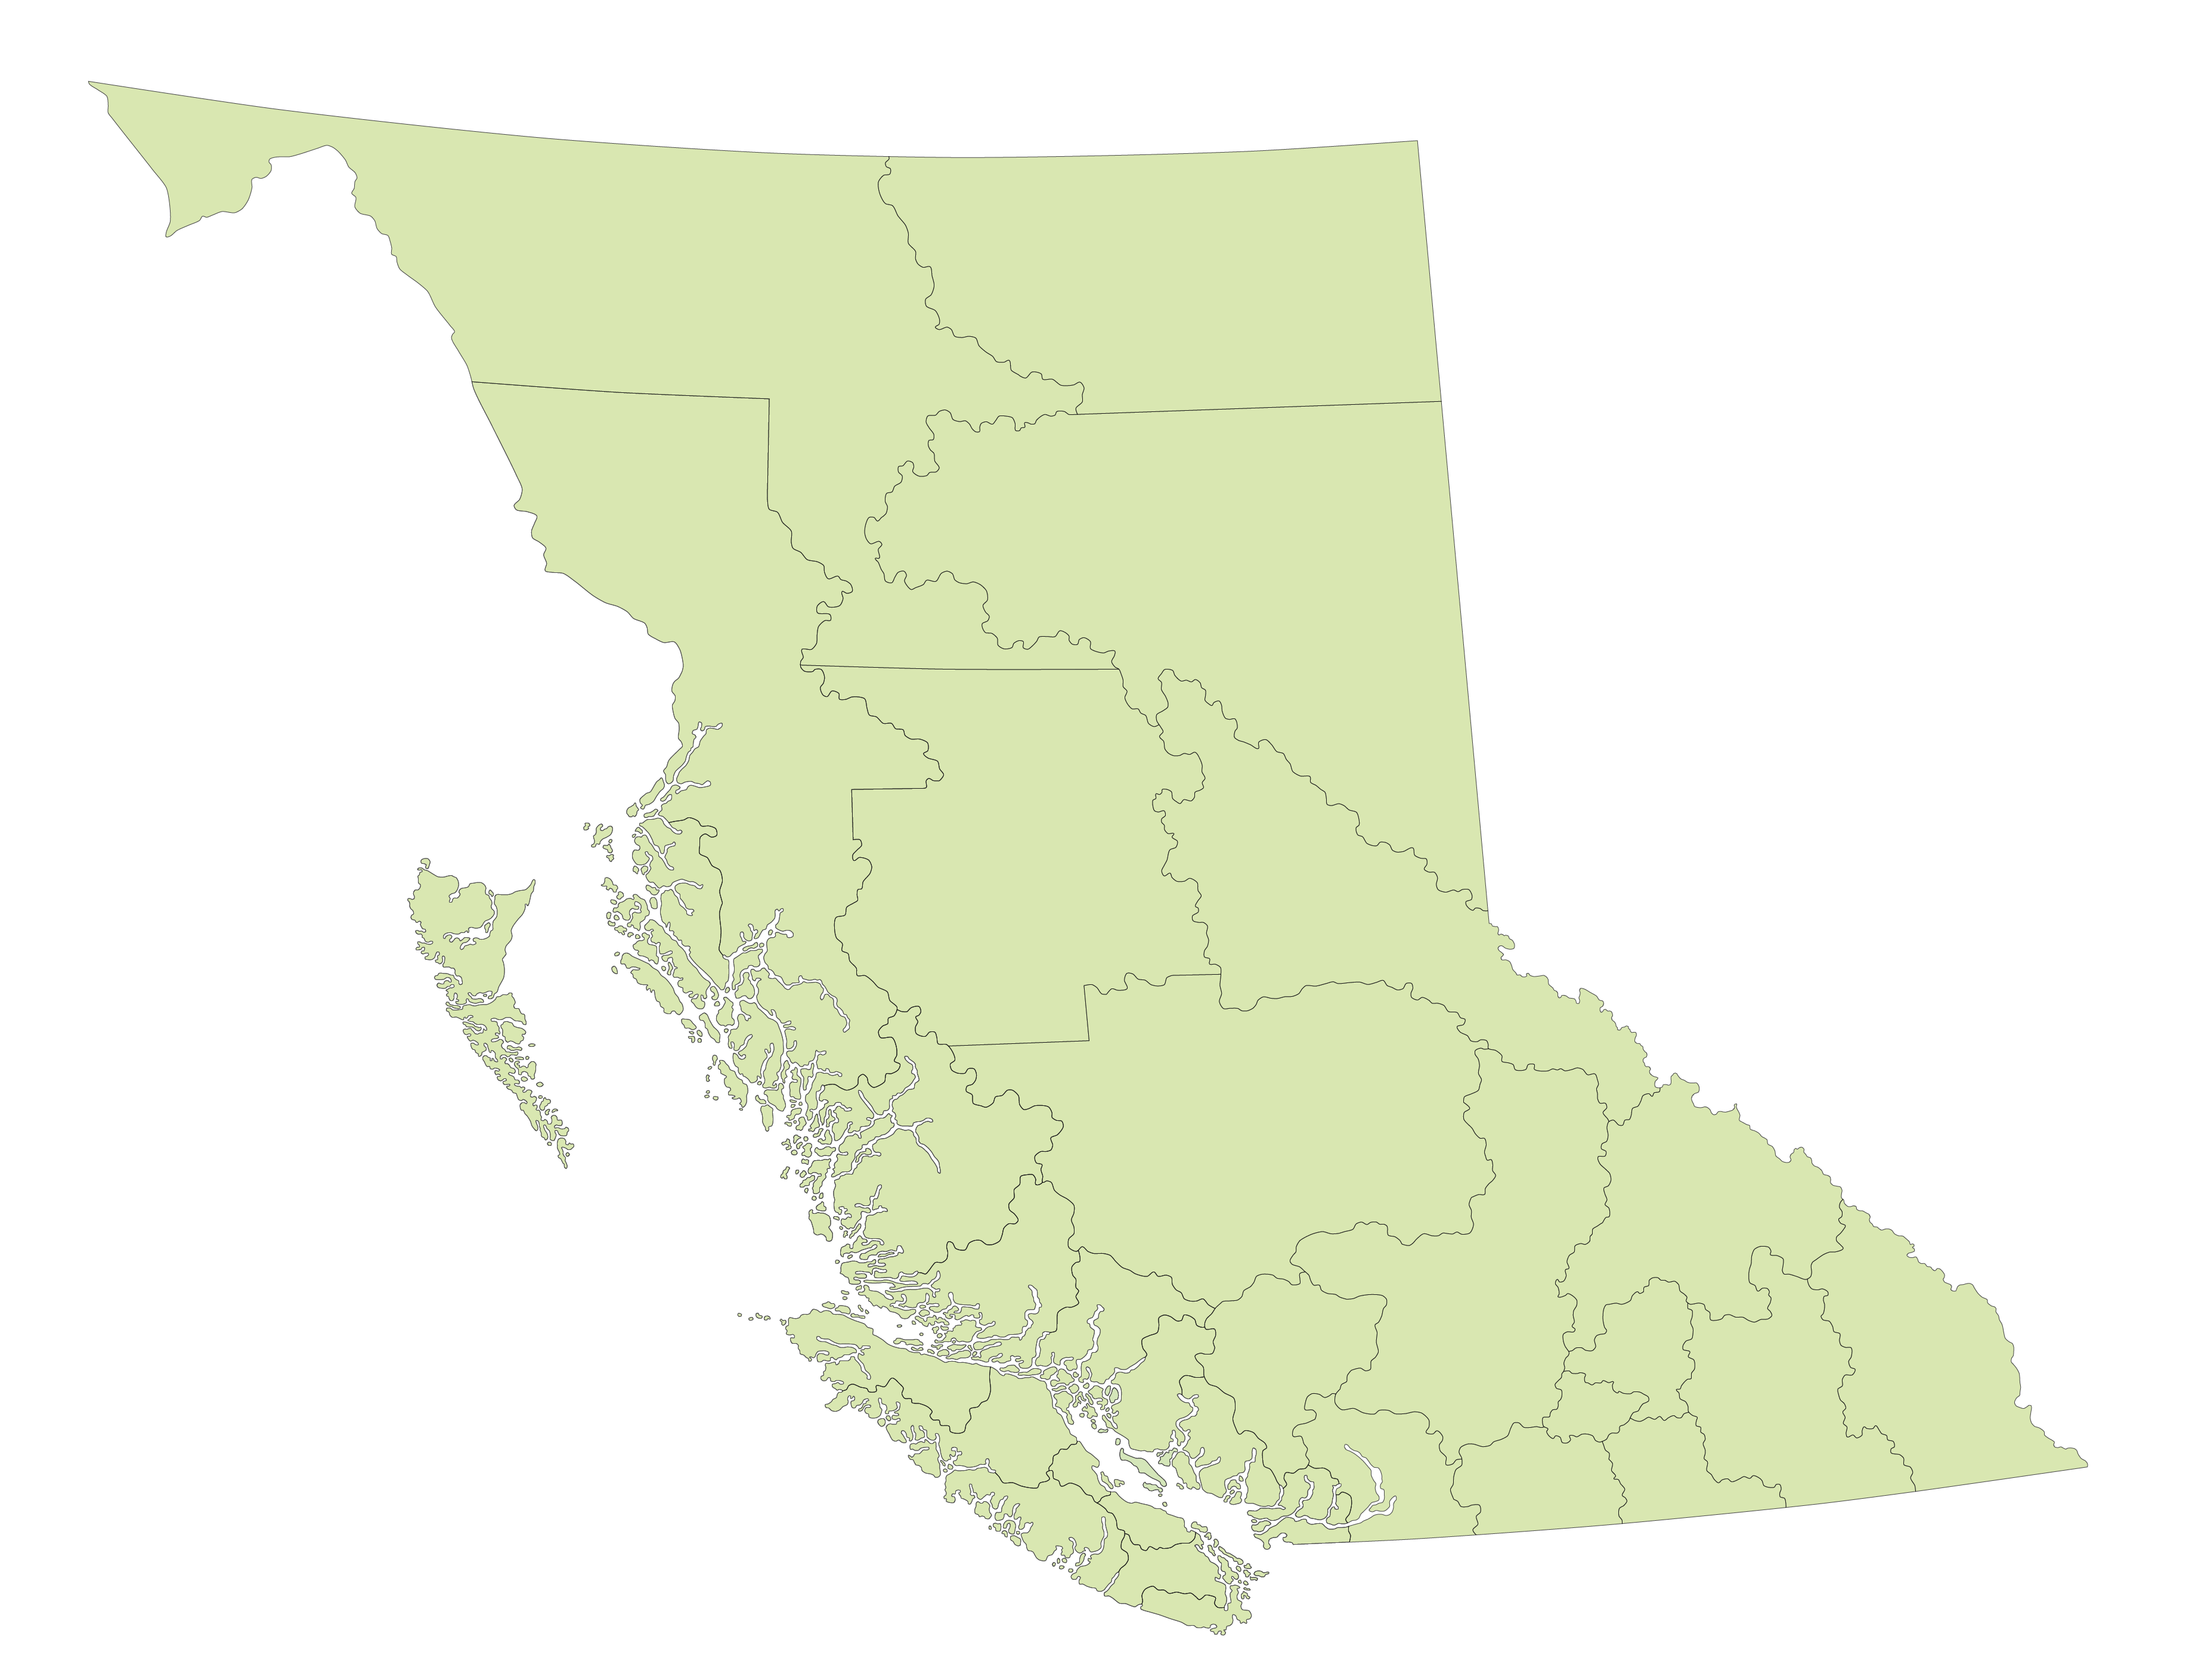
Bulkley-Nechako - 11.7%
Cariboo - 27.6% -------
27.6% of households in Cariboo Regional District reported experiencing poverty in 2021. This marks an increase of #% since 2016
Here is a second short paragraph of text.
Visit our homelessness grant page.
Thompson Nicola - 10.3%
10.3% of households in Thompson Nicola Regional District reported experiencing poverty in 2021. This marks an increase of #% since 2016.
Fraser Fort George - 6%

6% of households in Fraser Fort George Regional District reported experiencing poverty in 2021. This marks an increase of #% since 2016.
Peace River - 6.6%
This content is in bold text. 27.6% of households in Cariboo Regional District reported experiencing poverty in 2021. This marks an increase of #% since 2016
Here is a second short paragraph of text.
Visit our homelessness grant page.
Greater Vancouver - 16.5%
16.5% of households in Greater Vancouver Regional District reported experiencing poverty in 2021. This marks an increase of #% since 2016.
qathet - 11.1%
11.1% of households in qathet Regional District reported experiencing poverty in 2021. This marks an increase of #% since 2016.
Nanaimo - 10.9%

10.9% of households in Nanaimo Regional District reported experiencing poverty in 2021. This marks an increase of #% since 2016.
Fraser Valley 15.4%
15.4% of households in Fraser Valley Regional District reported experiencing poverty in 2021. This marks an increase of #% since 2016.
Comox Valley 9.2%
9.2% of households in Comox Valley Regional District reported experiencing poverty in 2021. This marks an increase of #% since 2016.